Intelligent Airing
Introduction
In this post, I will detail my solution to intelligently air a room in order to ensure proper humidity. The solution is based on an Arduino board, a humidity sensor and some other components. This post is aimed at technically minded people, ideally posessing some Arduino experience.
What I’ll not tell you
This post will not be one of the many “here’s the code and diagram, just copy and paste” Arduino posts. Instead, I’ll describe the hardware I used and most of the code. But my point here is to make you understand which methods I used and why I built what I build. Not to encourage you to just copy and paste it. I don’t think that’s how you learn things, and I think most of the Arduino tutorials around are not really tutorials.
Also, what I currently have is much more than what I’m showing you, and I was simply too lazy to strip it down again just to make describe it here.
How can you air a room intelligently?
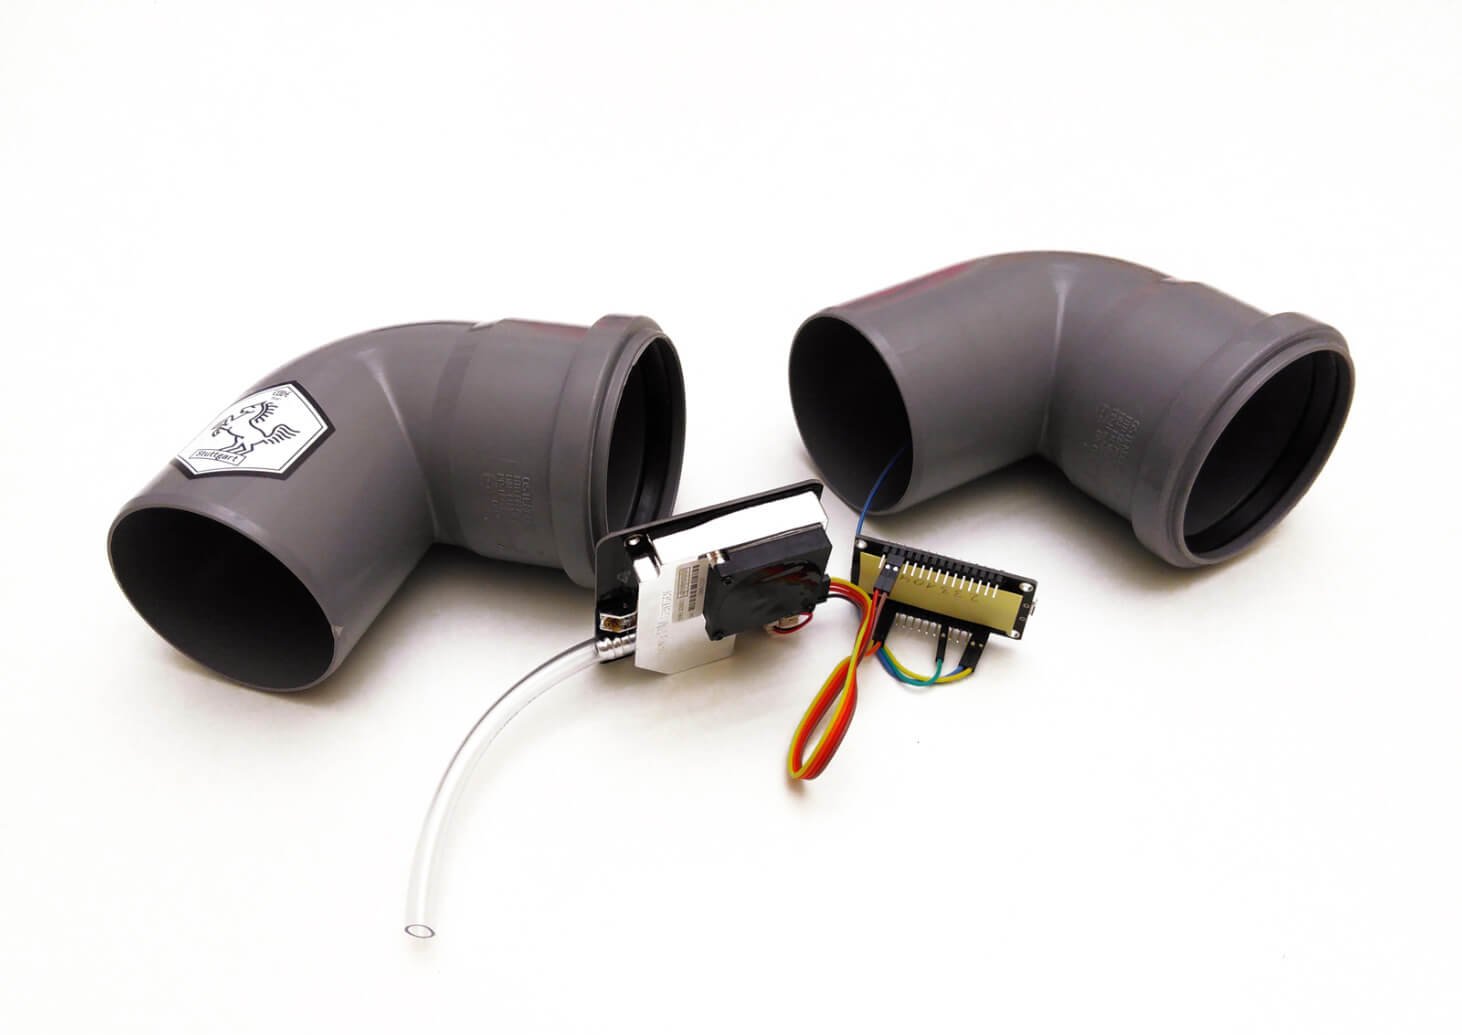
A quick backstory on this. There’s a German project called luftdaten.info (literally “airdata.info”). It was founded in order to establish a crowd-sourced network of sensors for measuring air quality. It isn’t about humidity, but about fine dust, which, in some German cities like Stuttgart, is a real problem and we need more data in order to put pressure on politicians.
Anyway, in order to participate, you build a sensor yourself, install it outside your home somwhere, connect it to the internet, and can then view your sensor’s data on a publicly accessible Grafana instance:

Before attaching it outside, however, I kept it inside, just to see how the humidity in the room is and, especially, how it changes:
Quick Googling tells me that your home shouln’t have more than 65% humidity. Otherwise, mould develops, which is a health hazard. In order to lower the humidity, the best thing in my climate region is to just open the windows. The usual recommendation to do this is “inrush airing”, meaning you open the windows wide for about 5-10 minutes, then close them again. You do that multiple times a day.
So far the theory. But…does it work?
Investigating
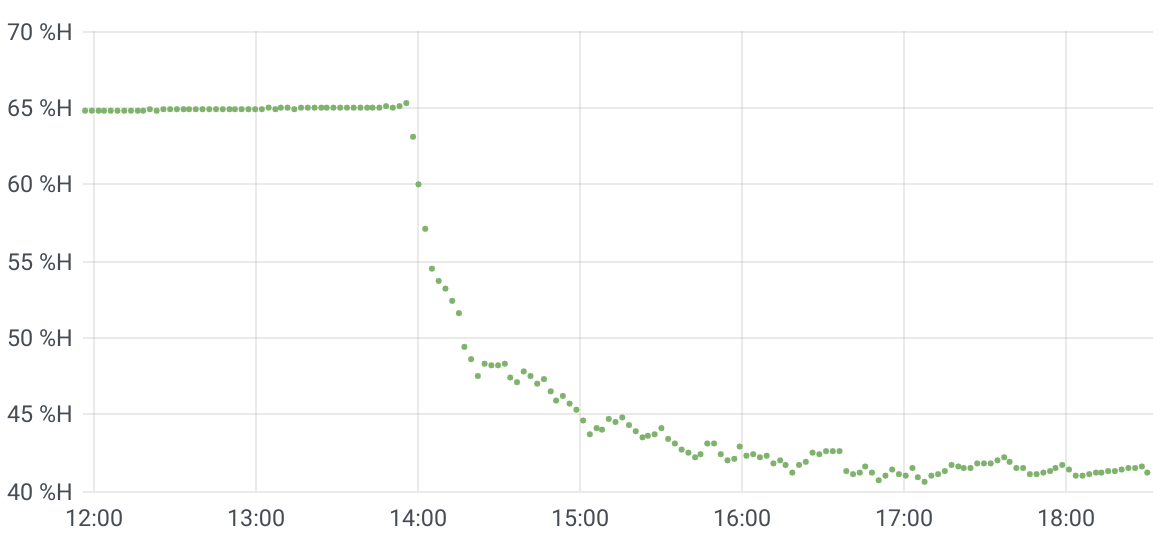
Let’s look at a typical example of the effects of airing my apartment:

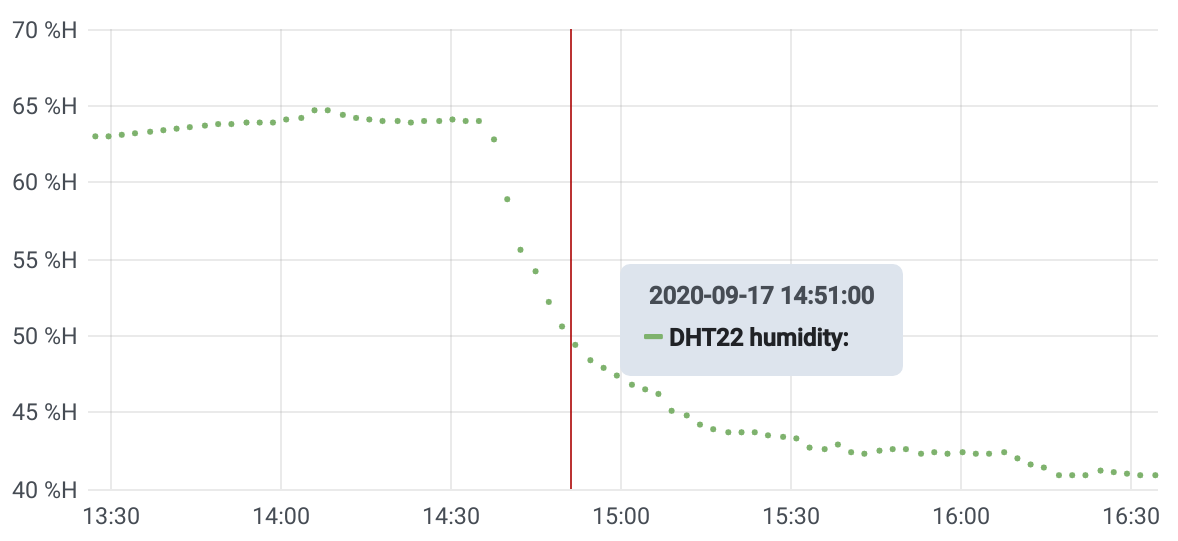
As you can see, our baseline is a flat 65% humidity. Around 2pm, I opened all the windows. Humidity quickly drops and peters out at around 4pm. Of course, that’s not the recommended “inrush airing” method. Inrush airing for about 5-10 minutes would’ve decreased humidity from 65% to only around 60%. To really flatten the curve, we need about 4 hours of airing, not 5 minutes. You can see this type of curve again, here:

This time, we only need about 1-2 hours of airing to get to around 40%.
So in summation, inrush airing doesn’t work well, and there’s no general rule of thumb available to gauge when to stop airing. Consequently, we need something smart. I decided to build just that.
The Project
What I envisioned was the following:
-
Use a sensor to measure humidity in discrete time intervals. For example, measure every minute. Keep a history of recent measurements. For example, keep the last hour of measurements
-
If the humidity is above a certain threshold (65%, for example), enable a red LED.
-
If the humidity is currently sinking, enable a yellow LED.
-
If the humidity is below a certain threshold and stays there, enable a green LED.
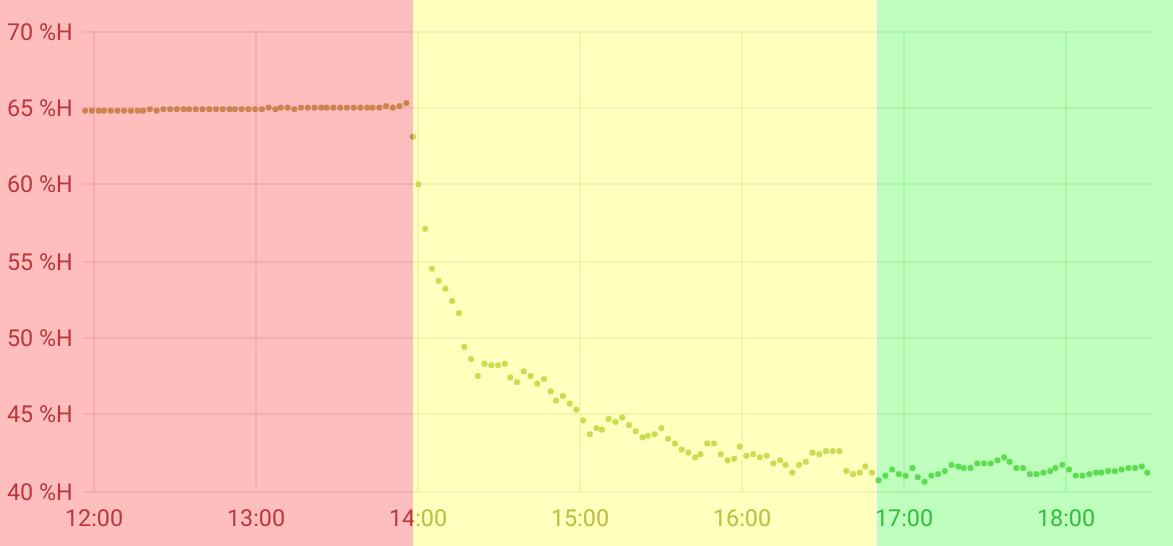
When you apply these rules, the following “LED color zones” result:

This leads to the following simple airing method: When you see a red LED, you open all windows until it’s green.
Why the yellow LED, you might ask. Couldn’t we just switch from red to green when a threshold is crossed? The thing is, there’s no fixed lowest humidity. Sometimes after hours of airing, we get to around 40%. Sometimes, after half an hour, humidity stays at 50%. It depends on the temperature and exterior humidity. So “airing until lower than 50%” doesn’t cut it. We need to know if something is happening instead, so we don’t “under-air” or “over-air”.
Of course, theoretically, this method might never end. If the humidity oscillates — falling, then rising again, and so on — then we’ll always be yellow or red. Observational evidence suggests, however, that this scenario doesn’t happen. If the windows are open, humidity falls until stagnant.
Waiting for the sensor, writing tests (you can skip this section)
Test setup
After specifying what I wanted to do, I ordered a DHT22 sensor, and then the project was stuck. Or was it? Could I start coding beforehand, possibly testing everything and then just assemble the whole thing? Maybe.
My idea can be summarized as follows:
-
I write the whole Arduino code in a
.inofile, which is just C with some implicit#includestatements and without amainfunction. -
This
.inofile I can then later upload to the actual Arduino. -
However, I can also
#includethis.inofile inside a mocked Arduino C environment, where all the functions accessing the outside world are replaced by ones that I can explicitly feed input into.
I tried implementing that, and quickly got results. The basic setup looks like this:
void digitalWrite(uint8_t pin, uint8_t val) {
  std::cout << "pin " << pin << ": write " << val << "\n";
}

int digitalRead(uint8_t const pin) {
  // We’ll get to that later
}

// Current time since the arduino started
unsigned long my_current_time_us = 0;

void delay(unsigned long ms) {
  std::cout << "waiting " << ms << "ms\n";
  my_current_time_us += ms*1000;
}

// same for micros, and so on

// Include my actual Arduino code here
#include "my-sensor-stuff.ino"

// Mock the Arduino behavior.
int main() {
  setup();
  while (true)
    loop();
}
You can compile this using a normal C++ compiler such as gcc and run it.
The Arduino code we write we now consider as a black box. The code reads via digitalRead and outputs via digitalWrite, and we need to feed it data whenever it requests it.
What data to we feed it? In my project, I only need the Arduino’s digital pins, and there’s 13 of them. Whenever a digitalRead happens, we get a pin number from the calling code (a number from 1 to 13) and have to return a boolean, indicating if this pin is currently high or low.
Thus, to simulate “the outside world”, all we need is a sequence of answers to these “is pin x high or low”. I decided to encode these answers in a plain text file. One line of the file consists of one answer to one query. It contains either zero or a pin number. Zero indicating that the requested pin (whatever it is) is low, otherwise indicating which pin is high.
An example might help explain this. Consider the following Arduino code:
if (digitalRead(13) && digitalRead(10)) {
  digitalWrite(8, HIGH);
}
This tests of both pins 13 and 10 are high, and if so, writes a high value to pin 8. We can trigger this write using the following protocol:
13
10
Whereas this protocol file wouldn’t trigger the write:
0
10
Here, the first digitalRead(13) will return low, the second one will return high.
DHT22
Since the DHT22 I ordered was still on the way, I couldn’t really test its output, I had to look up the spec. Reading from the chip seemed a bit daunting, and usually, you shouldn’t bother implementing it yourself. Adafruit has a finished implementation of the read functions. However, since I wanted to test the sensor with my little test framework, I had to look at the code and figure out which digitalRead calls to answer which way. Let me explain this briefly, considering we want to plug the DHT code into our test framework.
Whenever you read from the DHT22, you need to…
-
…set the data pin to
INPUT_PULLUPmode -
…then wait a bit
-
…then set the data pin to
OUTPUTand write a low value -
…then wait a bit
-
…then set the data pin to
INPUT_PULLUPmode again -
…then wait a bit
-
…then wait until you read a high value on the data pin
-
…then wait until you read a low value on the data pin
-
…then read the bytes
For testing, we can ignore all the waiting and mode setting. Let’s assume the data pin is pin 13. The protocol for reading a sensor always starts with:
13
0
Signifying the high and low waits at the start.
To read a single bit, the sensor code waits until it receives a high value, then waits until it receives a low value, and remembers for how long it waited for each one. If we waited longer for a low than a high, we have a 1, otherwise we read a 0. Simple as that.
We can simplify this in the testing protocol. To let the Arduino code read a 1, we encode
13
13
0
Meaning we waited 1 cycle for a low. To let it read a 0, we encode
0
13
0
Meaning we waited 1 cycle for a high.
And with that in place, we can encode a whole sensor reading. It consists of five bytes:
-
First, the humidity is encoded using two bytes. To encode “34.5%” humidity, you take the number “345” and encode its bytes h₀ and h₁. Later, this is decoded as h₀+h₁·0.1.
-
Same thing with two temperature bytes t₀, t₁
-
Then you encode one checksum byte with the formula:
(h₀+h₁+t₀+t₁) & 0xff
And each bit of these bytes you encode as three protocol lines, as shown above. I wrote a small Haskell tool that lets me generate sensor readings for me. This way, I could program away without the sensor.
The algorithm
To check if the humidity is falling, I implemented a simple linear regression algorithm. This method is used to fit a straight line through a point cloud:

More formally, the idea is we have a set of points (xᵢ, yᵢ), where in our case, xᵢ represents the time a measurement occured, and yᵢ represents the humidity. We have a function f(t) = α + tβ representing a line which we’d like to fit to the point cloud. This means we need to find suitable values for α and β. α represents the vertical displacement of the line and β represents the inclination. We’re actually only interested in the inclination, so we only need to find a good value for β.
There’s more than one way to “fit” the line to the point cloud, but one way that works good is by minimizing the quadratic distance of the measurement points to the line (sometimes called Simple linear regression or least squares method). The somewhat daunting formula for this is:

Some symbols I already explained, so you know xᵢ and yᵢ. The variants with the bar above it are simply the average values for the time and humidity. For xᵢ, this seems a bit silly (what’s the average time of a measurement‽), but just go with it.
Instead of using milliseconds or something based in reality, I chose to simply number the measurements and use that as my xᵢ values. So really, xᵢ is i. yᵢ are of course decimal numbers representing humidity.
To represent our measurements, I use the following variables:
unsigned const max_readings = 10;
float readings[] = { 0, 0, 0, 0, 0, 0, 0, 0, 0, 0 };
unsigned no_readings = 0;
unsigned current_reading = 0;
Let’s go thorugh them:
-
max_readings -
is the maximum number of measurements we want to accumulate; setting this to 10 means we gather 10 data points (meaning 10 minutes if we measure every minute)
-
readings -
stores the actual measurements, so our yᵢ
-
no_readings -
is the number of measurements we took so far; this’ll be less than 10 initially, but won’t go above 10.
-
current_reading -
is the index of the next humidity value to write inside the
readingsarray
The reason this is a bit more complicated is that we want to store a constant amount of measurement values inside the Arduino, without changing the measurement array too much. Let’s go through our measurement process:
-
Initially, we have no measurements at all, so
no_readingswill be zero. -
The first measurement will then be written to
readings[0]andcurrent_readingwill afterwards be 1. -
The second reading will be written to
readings[1]andcurrent_readingwill be 2. -
And so on until we hit the tenth reading,
readings[9]. After this is written, we store the next data point inreadings[0]again. At this point, we have, from oldest to newest, our data points atreadings[1]toreadings[9], thenreadings[0]. We wrap around with our history. -
The twelfth reading will be stored in
readings[1]. Now we go fromreadings[2]toreadings[9], thenreadings[0], thenreadings[1].
I hope that’s not too confusing.
Let’s calculate the different parts of the formula above. First, we need ̄x, the average x value. As I said, the x values are simply indices. So we need the sum of all numbers from 1 to 10 (max_readings). Didn’t Gauß invent something for that? He did, it’s really simple, even in C!
float average_x_values() {
  return (no_readings * (no_readings + 1) / 2.0f) / no_readings;
}
It’s simply n · (n+1) / 2, and since we need the average, we divide by no_readings at the end.
Okay, now we need ȳ, the average of all measurements. That’s pretty simple too, although we need a loop this time:
float average_humidity_values() {
  float result = 0.0f;
  for (unsigned i = 0; i < no_readings; ++i)
    result += readings[i];
  return result / no_readings;
}
As you can see, this is really just the usual average.
With that in place, we have xᵢ, yᵢ, ̄x and ȳ, so we can calculate β. Let’s separate the fraction and calculate the denominator first:
float regression_denominator() {
  float result = 0.0f;
  float avg = average_x_values();
  for (unsigned i = 1; i <= no_readings; ++i)
    result += (i - avg) * (i - avg);
  return result;
}
Here we’re being lazy, you can try fiddling around with the sum formula to get something more efficient, but we’re ignoring performance here, mostly.
The last piece of the puzzle is the numerator then. This is the most complicated part of the calculation, and to make it a little simpler, we’re splitting this up into two cases:
-
we have less than or equal to 10 readings so far
-
we have more than 10 readings
Let’s do the first case:
float regression() {
  float const avgx = average_x_values();
  float const avgy = average_humidity_values();
  float result = 0;

  if (no_readings < max_readings || current_reading == 0) {
    for (unsigned counter = 0; counter < no_readings; ++counter) {
      result += ((counter + 1) - avgx) * (readings[counter] - avgy);
    }
  } else {
    // part 2 comes here
  }
  return result / regression_denominator();
}
Here, we have a loop over all readings so far, and we quite simply implement the formula, using our averages from before.
Now for the case where we have more than 10 measurements, so our history wraps around, as described above:
for (unsigned counter = 0, idx = current_reading; counter < no_readings; ++counter) {
  result += ((counter + 1) - avgx) * (readings[idx] - avgy);
  if (idx == max_readings - 1)
    idx = 0;
  else
    idx++;
}
This is still not rocket science, but it’s a little involved. We still need a counter, because we need to loop through our history exactly 10 times. However, to access our history we use a separate idx variable that starts at current_reading (whereas counter starts at zero). Recall that current_reading is the variable specifying where the next history element will be written to. Put differently, it points to the oldest history entry. That’s where we start our loop. Note that we still use counter+1 for our x value. That’s intentional, because counter in this case represents the age of the entry behind idx. The oldest entry has counter value 0, the youngest has value 9. Finally, we have an if statement because index should start again at zero if it’s over the right array boundary.
Okay, so with that in place, we have our regression function, which returns the inclination of our approximated humidity line. But what does that mean? It’s simple, really. Say we get back a value of 1. That means every minute, the temperature rises around 1°C.
The tools, (code) assembly
Here’s what I used for the project:
-
an RGB led which I had laying around
-
an Arduino Uno
-
lots of jumper cables
-
some 220kΩ resistors for the LEDs
-
a DHT22 humidity sensor
Assembly was pretty simple. Let me get back to you.